A weight-loss result does not reveal what changed inside the body. That is why a SURMOUNT-1 substudy used dual-energy X-ray absorptiometry, or DXA, to estimate fat and lean tissue before and after tirzepatide treatment. Its central finding was meaningful but narrower than some advertising language suggests: participants receiving tirzepatide lost substantially more fat than lean tissue, while losing more of both than participants receiving placebo.
The widely repeated approximately 75% fat and 25% lean split describes the composition of the weight lost. It does not mean participants lost 25% of their starting muscle, nor does it establish that muscle strength was preserved. For evaluating a service’s claims, the useful question is not whether it mentions this study, but whether its written promises match the population, measurements, formulation, and uncertainty the research actually addressed.
At a glance
- Paired-scan analysis
- The efficacy analysis included 160 participants: 124 receiving pooled tirzepatide doses and 36 receiving placebo; approximately 73% were female.Sources: [1]
- Changes from starting amounts
- At 72 weeks, body weight, fat mass, and lean mass changed by −21.3%, −33.9%, and −10.9% with tirzepatide, versus −5.3%, −8.2%, and −2.6% with placebo.Sources: [1]
- Share of tissue loss
- The detailed report attributed 74% of the lost weight to fat and 26% to lean tissue with tirzepatide, compared with 75% and 25% with placebo.Sources: [1]
- Measurement boundary
- DXA lean mass is lean soft tissue, not a direct measurement of skeletal muscle, strength, or physical performance.Sources: [1]
- Published correction
- An August 2025 correction changed Figure 4 fat- and lean-mass axis units to kilograms, not percent; the abstract’s percentage changes were not corrected.Sources: [3]
A randomized trial, followed by a much smaller scan analysis
SURMOUNT-1 randomized 2,539 adults without diabetes to once-weekly subcutaneous tirzepatide or placebo for 72 weeks. Eligibility required a body mass index of at least 30, or at least 27 with a weight-related complication. The 5-, 10-, and 15-mg groups identify research arms, not dosing instructions. Both medication and placebo groups received lifestyle counseling.
The DXA substudy enrolled 255 people at 28 sites with suitable scanners. Its efficacy analysis included 160 participants with baseline and follow-up scans: 124 receiving tirzepatide and 36 receiving placebo. Follow-up scans could come from week 72 or an early-discontinuation visit; three missing week-72 values were carried forward from an earlier observation. Thus, the sample was not simply everyone originally enrolled followed with complete week-72 measurements.
Participants analyzed averaged 46.2 years old, 102.5 kg in weight, and a BMI of 38.0; 73.1% were female and 75.6% were White. This provides direct evidence for a particular trial population, not a representative survey of everyone using weight-loss medication. Scanner size limits and interfering implants or devices also affected eligibility for the scan substudy.
The primary question concerned fat mass—not muscle preservation
The substudy’s primary objective was to determine whether the three tirzepatide groups, pooled together, produced a greater percentage reduction in fat mass than placebo. Changes in lean mass and absolute fat and lean mass were secondary outcomes. Body weight, waist circumference, estimated visceral fat, and the proportions lost as fat or lean tissue were evaluated in post hoc analyses.
Pooling increased the number available for the main comparison but reduced its specificity. The headline result is not a separate estimate for each dose, and it cannot identify a dose that uniquely preserves muscle. Statistical models adjusted continuous outcomes for their baseline values. The report states that there was no adjustment for multiple comparisons, making the distinction between the primary question and exploratory findings important.
The main trial had different coprimary endpoints: percentage weight change and the proportion losing at least 5% of starting weight. A body-composition endpoint should not be substituted for those outcomes, or for evidence about continued treatment. The separate SURMOUNT-4 maintenance analysis addresses a different research question rather than extending these DXA results.
STUDY DATA · GLP-1 Provider Brief
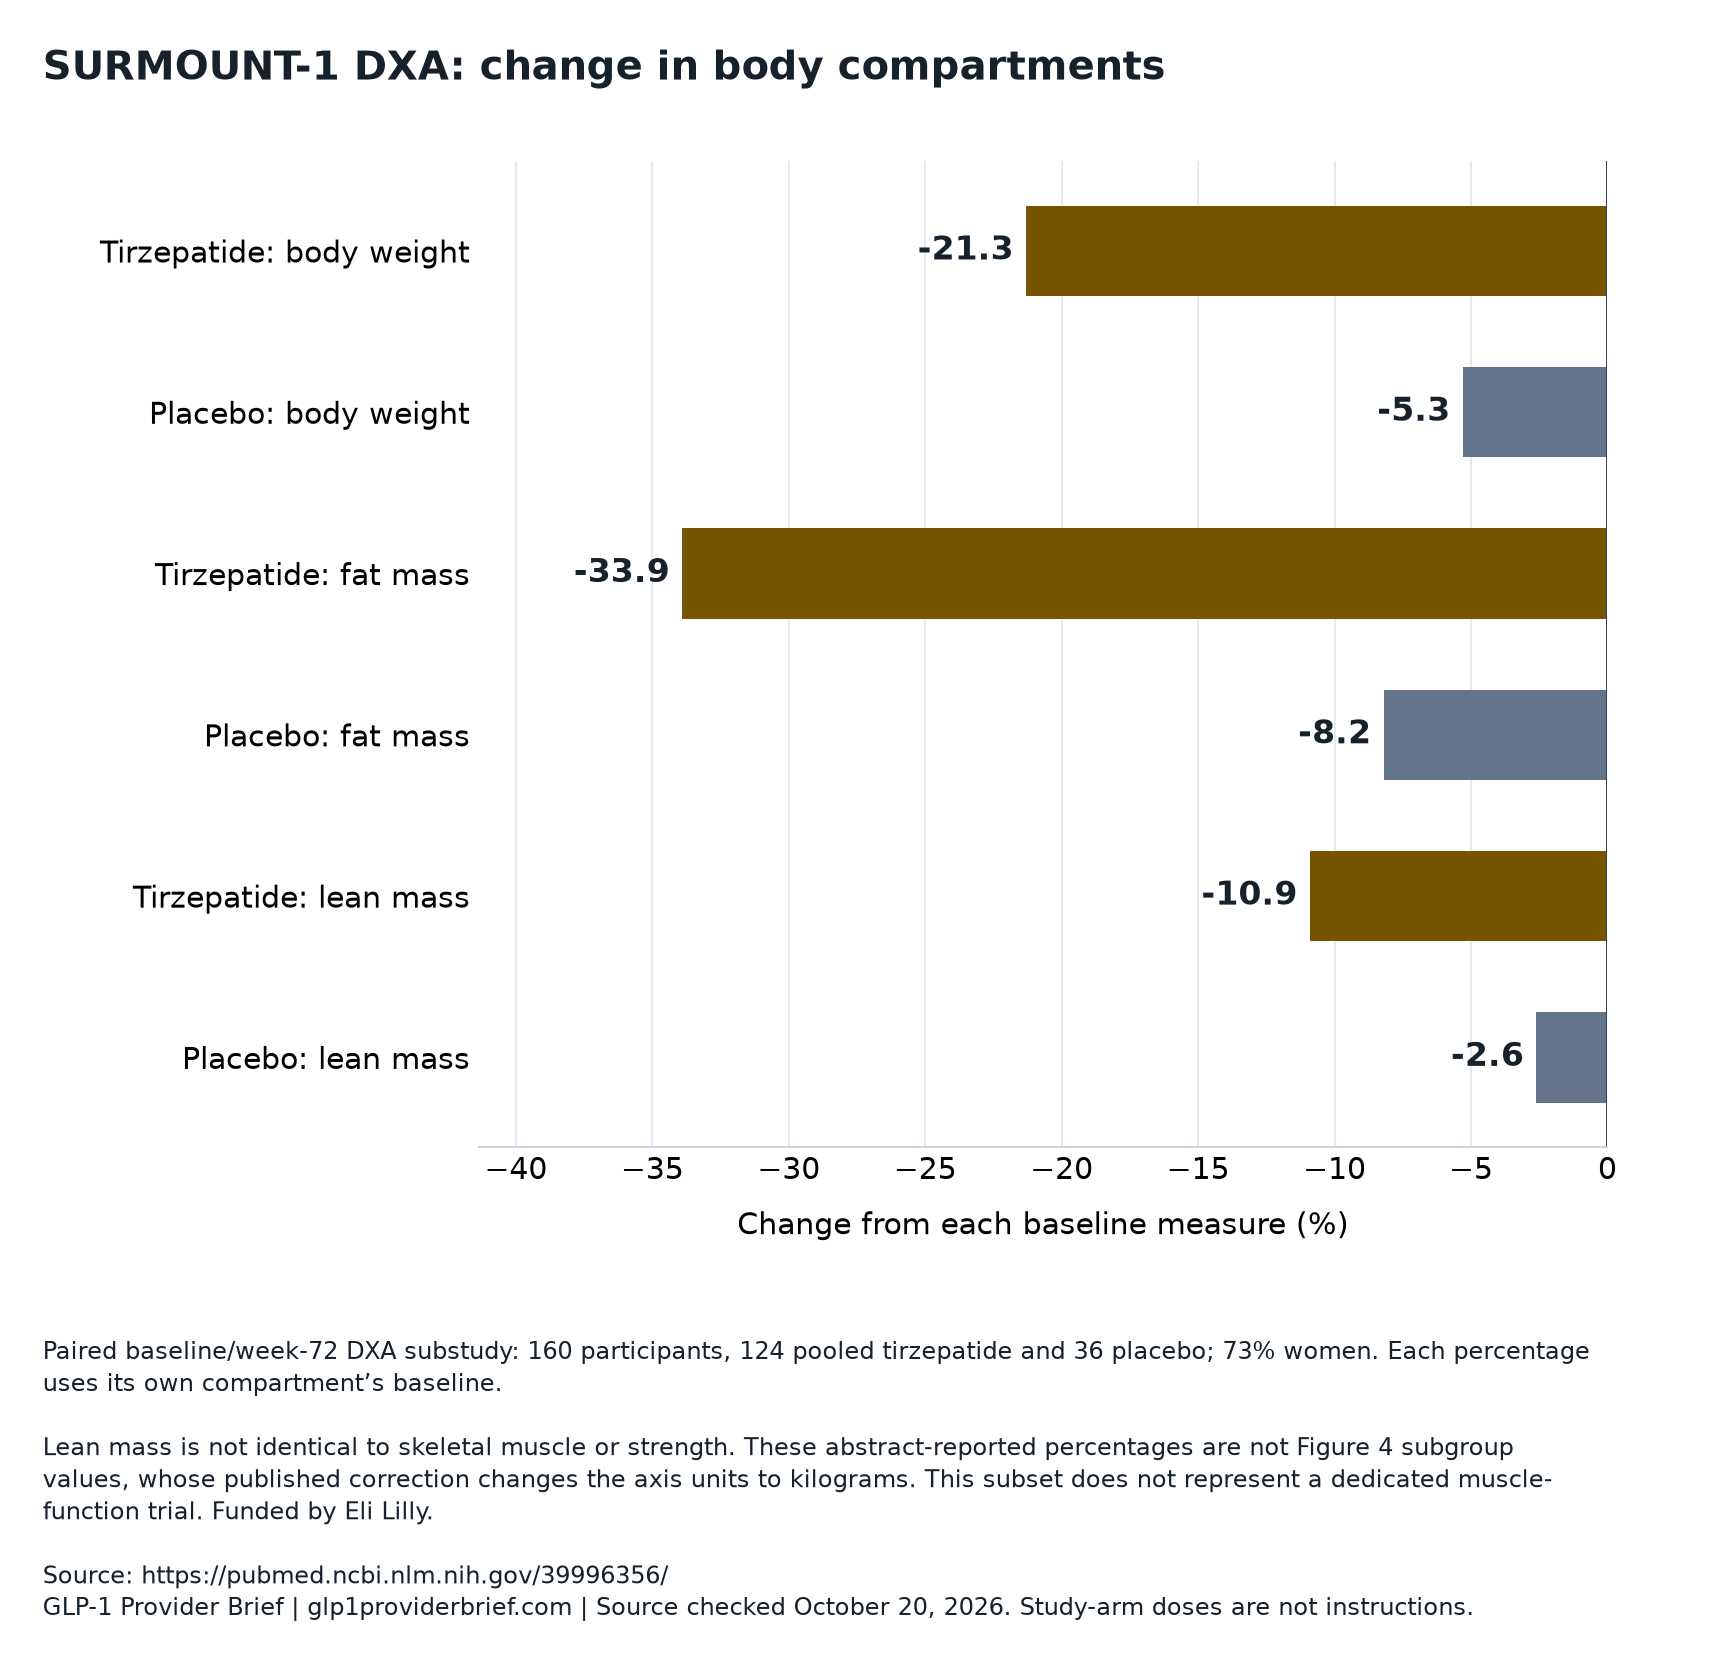
SURMOUNT-1 DXA: change in body compartments
Paired baseline/week-72 DXA substudy: 160 participants, 124 pooled tirzepatide and 36 placebo; 73% women. Each percentage uses its own compartment’s baseline.
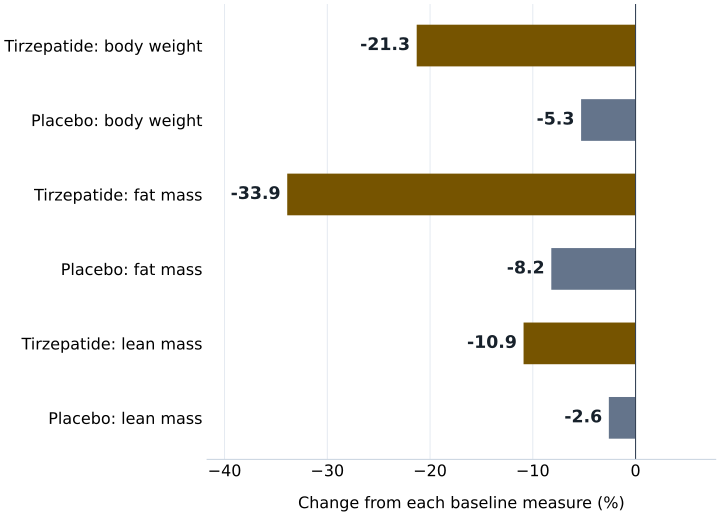
| Study group | Change from each baseline measure (%) |
|---|---|
| Tirzepatide: body weight | -21.3 |
| Placebo: body weight | -5.3 |
| Tirzepatide: fat mass | -33.9 |
| Placebo: fat mass | -8.2 |
| Tirzepatide: lean mass | -10.9 |
| Placebo: lean mass | -2.6 |
Lean mass is not identical to skeletal muscle or strength. These abstract-reported percentages are not Figure 4 subgroup values, whose published correction changes the axis units to kilograms. This subset does not represent a dedicated muscle-function trial. Funded by Eli Lilly.
Original visualization of published aggregate data. No individual prediction or provider performance is represented. Original research ↗
Three percentage changes, three different starting denominators
The reported reductions in weight, fat, and lean tissue use different denominators. Weight change is divided by starting body weight; fat change by starting fat mass; lean change by starting lean mass. Consequently, the 33.9% fat reduction and 10.9% lean reduction should not be added to explain the 21.3% weight reduction.
The table preserves the abstract’s baseline-percentage results. The between-group differences are percentage-point differences in percentage change, not relative risk reductions. For fat mass, the estimated difference was −25.7 percentage points, with a 95% confidence interval from −31.4 to −20.0. For lean mass it was −8.3 points, with an interval from −10.6 to −6.1.
These intervals describe uncertainty around average treatment differences under the analysis model, not the range of individual responses. They support greater average loss of both compartments with tirzepatide. They do not show that every participant lost the same proportion or that everyone experienced a clinically equivalent consequence from lean-tissue loss.
| Measure and denominator | Tirzepatide / placebo | Estimated difference versus placebo, 95% CI |
|---|---|---|
| Body weight; starting body weight | −21.3% / −5.3% | −16.0 percentage points; −19.4 to −12.6 |
| Fat mass; starting fat mass | −33.9% / −8.2% | −25.7 percentage points; −31.4 to −20.0 |
| Lean mass; starting lean mass | −10.9% / −2.6% | −8.3 percentage points; −10.6 to −6.1 |
What the approximately 75/25 split actually means
The study calculated the fat share as fat mass lost divided by fat mass lost plus lean mass lost. The detailed results were 74% fat and 26% lean with tirzepatide, summarized approximately as 75/25 in the abstract. Placebo produced a similar proportional split despite much smaller losses.
A worked illustration makes the denominator clear: if 10 kg of measured tissue loss consists of 7.5 kg fat and 2.5 kg lean tissue, lean tissue accounts for 25% of that loss. This says nothing by itself about the fraction of starting lean tissue lost, and still less about starting skeletal muscle. It is an illustration of the formula, not a prediction for an individual.
The observed absolute reductions help explain why a similar ratio does not mean an identical tissue burden. Average fat mass fell 15.9 kg with tirzepatide versus 3.6 kg with placebo; lean mass fell 5.6 versus 1.2 kg. The between-group lean difference was −4.4 kg, with a 95% confidence interval of −5.6 to −3.2. A proportionally similar loss can therefore coexist with substantially more kilograms of lean tissue lost.
A better fat-to-lean balance is not a strength test
DXA estimates lean soft tissue: nonfat tissue excluding bone mineral content. That compartment includes skeletal muscle but also water, organs, and other tissues. Calling the entire lean-mass change muscle loss overstates what the scan identifies. Conversely, calling a favorable fat-to-lean ratio proof of muscle preservation understates the measured lean reduction.
The scan procedures sought consistency. Participants were scanned on the same machine and software under similar conditions, including hydration, positioning, and time of day. A blinded central reader interpreted the scans. These measures strengthen comparisons, but they do not transform DXA into a direct measure of muscle quality, grip strength, balance, or ability to rise from a chair.
The report discusses improved self-reported physical function in the broader SURMOUNT-1 population. Those questionnaires are relevant but do not establish preserved strength in the paired-DXA sample. An unresolved question is how changes in particular muscles, tissue quality, and objectively measured performance relate over time. The substudy did not evaluate nutrient intake or physical activity in relation to DXA changes, so it cannot validate a specific muscle-preservation program.
Subgroups and the corrected figure need restrained interpretation
The researchers explored results by sex, age, and thirds of achieved weight loss. Broadly, fat accounted for most of the lost tissue across these categories. But these were post hoc analyses in small groups, not separately powered trials designed to settle outcomes in older adults or people vulnerable to functional decline.
Grouping people by achieved weight loss is particularly easy to overread. Greater losses were accompanied by greater absolute fat and lean losses, but the groups were defined by an outcome after treatment, not randomly assigned weight-loss targets. Such comparisons cannot establish that deliberately reaching a particular loss threshold causes a specific tissue ratio.
The August 20, 2025 correction matters here: Figure 4’s fat- and lean-mass vertical axes should be labeled kilograms rather than percent. It corrected those units, not the abstract’s percentage changes. A chart based on the abstract should therefore use the baseline-percentage results shown above; Figure 4 values should not be presented as percentage losses. Correct units are essential when claims depend on the apparent size of subgroup differences.
Missing scans and analysis choices shape the uncertainty
Only 160 of the 255 substudy enrollees entered the reported efficacy analysis, approximately 63%. Having fewer analyzed participants than enrolled does not automatically invalidate a finding, but it raises a selection question: were participants with paired scans systematically different from those without them? Randomization in the original trial does not by itself eliminate every concern created by subsequent missing measurements.
The analysis required treatment exposure and nonmissing baseline and postbaseline DXA data. Carrying earlier measurements forward for three missing week-72 values also assumes those observations can stand in for later outcomes. These details matter when interpreting the result as an estimate at 72 weeks rather than a complete record of every randomized participant’s trajectory.
Eli Lilly funded the work and participated in design, data collection, analysis, interpretation, writing, and submission decisions; several authors were employees and shareholders. Sponsorship does not negate the measurements, but transparent disclosure helps readers assess evidence production. Independent replication, larger older-adult samples, direct performance testing, and longer observation would address questions that the large average fat reduction alone cannot resolve.
The parent trial supplies safety context, not a blanket assurance
The indexed primary SURMOUNT-1 abstract reports weight changes of −15.0%, −19.5%, and −20.9% for the three tirzepatide groups, versus −3.1% for placebo. Those are treatment-regimen estimates intended to assess effects regardless of treatment discontinuation. They differ from the selected, pooled-dose DXA analysis in both population and analytical question; mixing them into one apparent result would be misleading.
Gastrointestinal adverse events were the most common with tirzepatide, generally mild to moderate and concentrated during dose escalation. Adverse events led to treatment discontinuation in 4.3%, 7.1%, and 6.2% of the respective tirzepatide groups, compared with 2.6% on placebo. These findings belong alongside the efficacy results, not beneath an unqualified statement that treatment was safe.
The composition analysis does not establish the incidence of functional harm from lean loss or prove that such harm cannot occur. Nor does it identify the best method of preventing it. The parent trial’s safety experience and the substudy’s tissue measurements answer complementary questions; neither substitutes for current prescribing information or individualized clinical evaluation.
A separate function trial illustrates the evidence still needed
STEP-HFpEF offers a useful methodological contrast, not a direct confirmation of tirzepatide’s muscle effects. It randomized 529 people with obesity and heart failure with preserved ejection fraction to once-weekly semaglutide 2.4 mg or placebo for 52 weeks. Novo Nordisk funded that study. Its drug, population, and endpoints differed from the SURMOUNT-1 DXA analysis.
Its dual primary endpoints were a heart-failure symptom and limitation score and body-weight change. Six-minute walking distance was a confirmatory secondary endpoint: the estimated treatment difference was 20.3 meters, with a 95% confidence interval of 8.6 to 32.1. Serious adverse events occurred in 13.3% on semaglutide and 26.7% on placebo. Neither result establishes skeletal-muscle preservation or isolates why walking performance changed.
The point of the comparison is measurement: function can be tested directly rather than inferred from body composition. The STEP-HFpEF symptoms and function analysis develops that distinction. A service cannot borrow its performance result to claim that tirzepatide, a different formulation, or its own support package will preserve strength.
Translating the findings into defensible written claims
A defensible summary says that pooled tirzepatide treatment produced predominantly fat loss, with accompanying lean-tissue loss, in a selected 72-week DXA analysis. Claims of guaranteed muscle preservation, improved strength, or provider-specific results need evidence beyond that statement. The table distinguishes the supporting documentation each claim would require.
Product identity also matters. FDA states that compounded drugs are not approved or reviewed before marketing for safety, effectiveness, or quality; trial results do not establish equivalence for compounded preparations. FDA also identifies dosing errors and semaglutide salt-ingredient concerns. Those reports alone cannot establish event rates or causation. The product-terms guide explains why formulation should be identified before clinical results are compared.
Editorial interpretation: a research citation is not a contractual outcome promise. The evidence-boundaries guide helps separate those categories. For documentary checks only, the CoreAge Rx review and Mochi Health review offer places to examine written terms; these links imply neither availability of the studied product nor condition-specific care or trial-like outcomes.
| Claim | What this study supports | Documentation still needed |
|---|---|---|
| Most lost tissue was fat | An average pooled-dose finding in the analyzed sample | Accurate population, timeframe, denominator, and product identification |
| Our program preserves muscle | Not established by DXA lean-mass results | Program-specific comparative muscle and functional measurements |
| You will retain strength | No individual strength guarantee | Direct strength outcomes and a justified account of individual uncertainty |
| Our formulation delivers these results | Results apply to the studied intervention | Evidence for the actual formulation and route; equivalence cannot be presumed |
| Results are guaranteed or refundable | No contractual guarantee was tested | Written eligibility, exclusions, measurements, deadlines, and refund terms |
Questions & answers
Did participants lose 25% of their muscle?
No. Approximately 25% describes the lean share of the tissue lost, not the percentage of starting muscle lost. Average DXA lean mass declined 10.9% from baseline with tirzepatide. Because that measurement includes tissues other than skeletal muscle, even the 10.9% figure should not be relabeled as a direct muscle-loss estimate.
Does losing lean tissue mean physical function must worsen?
Not necessarily. Tissue quantity and functional performance are different outcomes. The report discusses improved self-reported function in the broader trial, but that does not establish preserved strength in the scan sample. Direct performance measurements would help determine who improves, who does not, and how those changes relate to tissue losses.
Did the correction invalidate the main findings?
The published correction addressed units on Figure 4: fat- and lean-mass axes should show kilograms, not percent. It did not correct the abstract’s baseline percentage changes. The practical consequence is to avoid treating the figure’s absolute tissue changes as percentages, especially when discussing weight-loss subgroups.
Can this trial identify a proven protein or exercise program?
No. Participants received lifestyle counseling, but there was no specific strength-training protocol, and the analysis did not examine nutrient intake or physical activity in relation to body composition. It therefore cannot determine which added program prevents lean loss or establish a numerical nutrition or exercise prescription.
What should a muscle-preservation guarantee explain in writing?
It should define muscle preservation, identify the measurement and timeframe, specify the actual product, and distinguish a clinical claim from refund eligibility. Editorial interpretation: a commercial guarantee may describe payment conditions without proving a biological outcome. The refund-boundaries guide can help evaluate that distinction; the DXA study itself tested no service guarantee.
Our assessment
SURMOUNT-1’s DXA analysis provides persuasive evidence that tirzepatide-associated weight reduction in the analyzed sample came predominantly from fat, alongside a measurable reduction in lean tissue. Its strongest finding is greater average fat loss versus placebo—not preservation of all muscle, proof of retained strength, or validation of a commercial care package. The appropriate evidentiary standard for service claims is proportional: cite the population and measurements actually studied, distinguish starting-mass percentages from shares of weight lost, and require separate evidence for promised functional or provider-specific outcomes.
Sources & documentation
Scientific and official sources consulted October 20, 2026. Study findings apply to the populations, products and time periods described; they are not provider outcome data.
- Body composition changes during weight reduction with tirzepatide in the SURMOUNT-1 study of adults with obesity or overweight. ↗
- Tirzepatide Once Weekly for the Treatment of Obesity. ↗
- Correction to "Body composition changes during weight reduction with tirzepatide in the SURMOUNT-1 study of adults with obesity or overweight". ↗
- Semaglutide in Patients with Heart Failure with Preserved Ejection Fraction and Obesity. ↗
- FDA concerns about unapproved GLP-1 drugs ↗